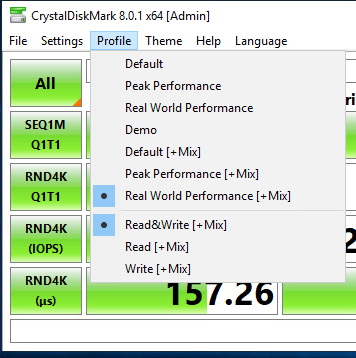
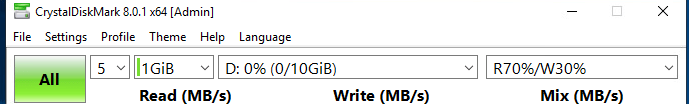
Last post I was looking at vCPU configuration on a vm to get best performance on a vm. Now it is time to take a look at performance on the disk side. To test performance I used CrystalDiskMark.
Finally I was able to add a file in WordPress, the link to the file is at the end of the post.
Goal
Goal for this test is to find what configuration gets the best performance just by doing configuration on the virtual machine and ESXi.
•84+ Different test scenarios
•Excel sheet so we can show the result in the findings
•When I look at the result I was looking from the VM side, closest to the end user. If we have 0,1 latency on the storage but 15ms on the vm that will effect users.
Takeaways
If you do not want to read all the text we do the summary at the beginning instead
•You need to know the load, how does this application works. Can you do some changes to the application to tweak threads for example?
•Is these values really real life scenarios (Diskmark settings queues and threads), I do not know, it depends on the application. You need to look at performance metrics first esxi,vm,storage. Next post ?
•On the VM when assigning the vCPU DO NOT count hyperthreading as a core. If you are only after CPU performance that can be different: https://jensoroger.wordpress.com/2021/03/30/test-vcpu-configuration-to-get-best-performance-out-of-a-vm-what-configuration-shall-i-use-vcpu-vexpert-vmware-virtualmachine-frankdenneman-numa-mwvme/
•Test your own system, my numbers are not your numbers. Different FC switch, faster CPU. Many things can be different.
•When you are having sequential data transfer it really doesn’t matter what you tweak. Always the same result. In my case anyway,
•Is these settings in vm and esxi really necessary, it can be enough to add 4 Paravirtulized controllers on the vm and split up the disks.
•Read this: https://blog.purestorage.com/purely-technical/understanding-vmware-esxi-queuing-and-the-flasharray-2/
•In my test I was alone, as the blog above explain.
•From above blog post from Pure Storage.
You might note that the latency in-guest is still a bit higher than DAVG, even though there is no queuing. This usually means there is an inefficiency in your app. Maybe TOO many threads etc. But figuring that out is beyond this conversation.
Explaining some stuff
Pure Storage
•Queue Time – Average time, measured in microseconds, that an I/O request spends in the array waiting to be served. The time is averaged across all I/Os of the selected types.
•Write Latency ![]() – Average arrival-to-completion time, measured in milliseconds, for a write operation.
– Average arrival-to-completion time, measured in milliseconds, for a write operation.
•Read Latency (R) – Average arrival-to-completion time, measured in milliseconds, for a read operation.
What settings was changes during the test
•CrystaldiskMark settings
•Queue
•Threads
•VM
•Queue Depth on the PVSCI Controller
•vCPU
•ESXi
•Queue Depth on HBA
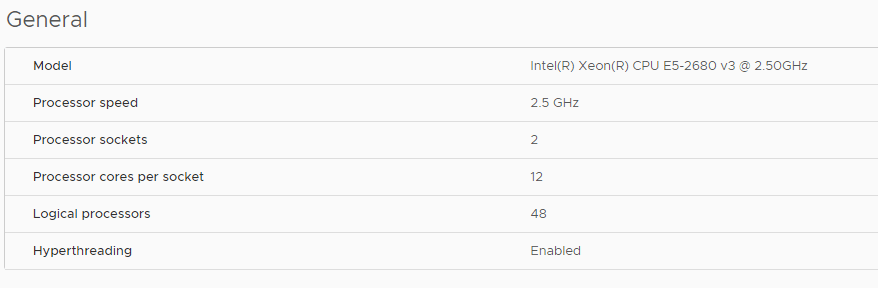
ESXi Server
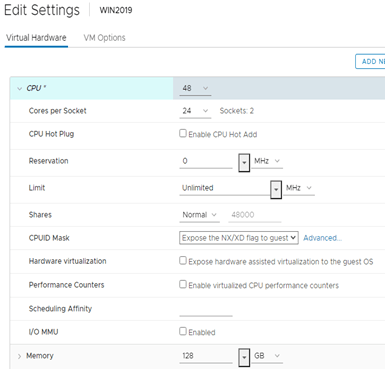
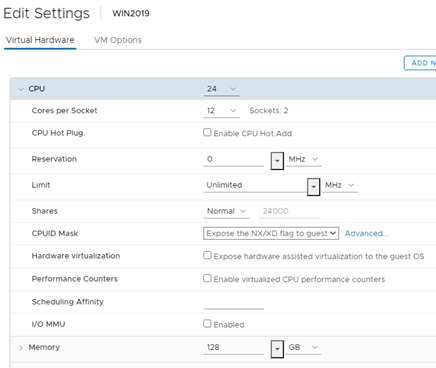
VM Configuration vCPU
I only used two different settings on the vCPU settings. Calculating with hyperthreading and not
Storage
Pure Storage
8GB Qlogic FiberChannel
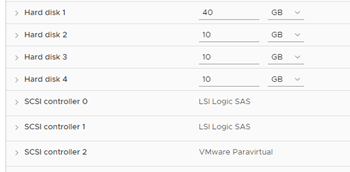
VM Configuration disk
Windows 2019 Server Fully patched 2021-05-03
128GB Ram
LSI Logic (SCSIController 0)
C:
LSI Logic (SCSI Controller 1)
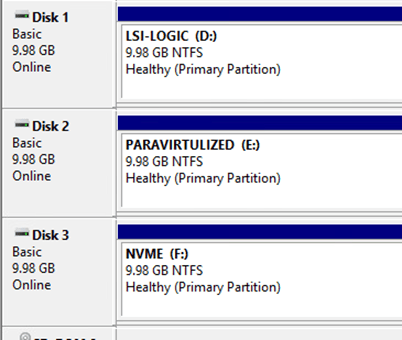
D:
Paravirtulized Controller (SCSI controller 2)
E:
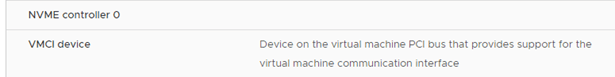
NVME Controller ( NVME Controller 0)
F:
CrystalDiskMark Values
•SEQ1M – Sequential Test for 1 Mebibyte block size data
•RND4K – Random Test for 4kb block size data
•RND4K (IOPS) – IOPS than can be pushed in Random 4 k block size
•RND4K (µs) – Latency in microseconds from VM
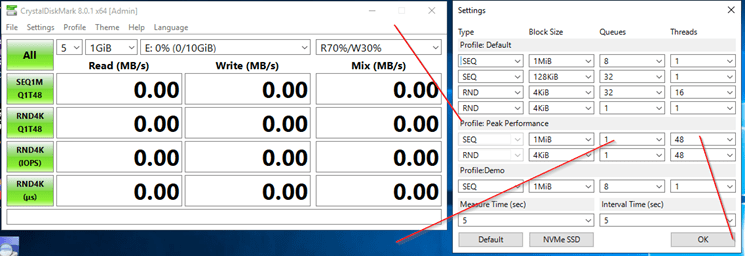
Test Scenarios
•With vCPU that uses all physical CPU with Hyperthreading (48 vCPU and 24 Cores per Socket)
•With vCPU that uses all physical CPU without hyperthreading (24 vCPU and 12 Cores per Socket)
•With standrad PVSCI Queue Depth
•With modified PVSCI Queue Depth
•REG ADD HKLM\SYSTEM\CurrentControlSet\services\pvscsi\Parameters\Device /v DriverParameter /t REG_SZ /d “RequestRingPages=32,MaxQueueDepth=1024”
•With standrad NVME Controller
•With standard Queue Depth on the HBA
•With modified Queue Depth on the HBA
•esxcli system module parameters set -p ql2xmaxqdepth=256 -m qlnativefc
Result – Explain the excel file
| Nr | Controller | Win Queue PVSCI | ESXi Queue | vCPU | Queues DiskMark | Threads |
| 1 | LSI | 254 | 256 | 48 | 1 | 48 |
| 2 | Paravirulized | 254 | 256 | 48 | 1 | 48 |
| 3 | NVME | 254 | 256 | 48 | 1 | 48 |
| 4 | LSI | 254 | 256 | 48 | 32 | 48 |
| 5 | Paravirulized | 254 | 256 | 48 | 32 | 48 |
| 6 | NVME | 254 | 256 | 48 | 32 | 48 |
Nr – Number in 1-84 Just a number to mark every test
Controller – Type of controller used in VM
WinQueue PVSCI – Queue Depth on the PVSCI controller Only usefull when controller is Paravirtulized
ESXi Queue – Queue Depth on the HBA
vCPU – How the CPU config was on the VM
Queues Cristal Diskmark – In practice, it means how many IO-operations the operating system is able to give to said device before waiting for a response to any of those operations.
Threads – Threads is how many processes are accessing the drive at once
Result – Explain the excel file cont.
| Nr | Controller | Win Queue PVSCI | ESXi Queue | vCPU | Queues DiskMark | Threads | Read SEQ1M | Read RND4K | Read RND4K IOPS | Read RND4K Latency | Write SEQ1M | Write RND4K | Write RND4K IOPS | Write RND4K Latency | Mix SEQ1M | Mix RND4K | Mix RND4K IOPS | Mix RND4K Latency | Pure Max Latency | Queue Time Pure | CPU On VM |
| 1 | LSI | 254 | 256 | 48 | 1 | 48 | 1603,07 | 467,57 | 102318,12 | 467,57 | 960,49 | 399,85 | 97618,9 | 490,06 | 2021,12 | 445,24 | 108700,2 | 439,6 | 3,16 | 0 | Minor CPU |
•Read SEQ1M – Sequential Test for 1M block size data
•Read RND4K – Random Test for 4k block size data
•Read RND4K IOPS – IOPS with Random Test for 4k
•Read RND4K Latency – Latency with Random Test for 4k
•Write SEQ1M – Sequential Test for 1M block size data
•Write RND4K – Random Test for 4k block size data
•Write RND4K IOPS – IOPS with Random Test for 4k
•Write RND4K Latency – Latency with Random Test for 4k
•Mix SEQ1M – Sequential Test for 1M block size data 70% Read 30% Write
•Mix RND4K – Random Test for 4k block size data 70% Read 30% Write
•Mix RND4K IOPS – IOPS with Random Test for 4k 70% Read 30% Write
•Mix RND4K Latency – Latency with Random Test for 4k 70% Read 30% Write
•Pure Max Latency – The highest latency that I saw in pure, mostly only writes
•Queue Time Pure – Average time, measured in microseconds, that an I/O request spends in the array waiting to be served
•CPU On VM – My feeling on how the CPU was treating the test Low,Less and High
Result – Explain the excel file cont.
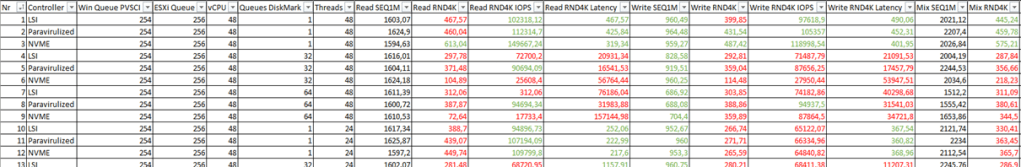
Then I used color to filter out good from bad.
How did I choose the numbers, knowledge!
•Read SEQ1M – N/A
•Read RND4K – Green +500 Red -500
•Read RND4K IOPS – Green +90000 Red -90000
•Read RND4K Latency – Green -10000 Red +10000
•Write SEQ1M – Green +500 Red -500
•Write RND4K – Green +500 Red -500
•Write RND4K IOPS – Green +9000 Red -90000
•Write RND4K Latency – Green -10000 Red +10000
•Mix SEQ1M – N/A •Mix RND4K – Green +400 Red -400
•Mix RND4K IOPS – Green +90000 Red -90000
•Mix RND4K Latency – Green -10000 Red +10000
Filter out the green result
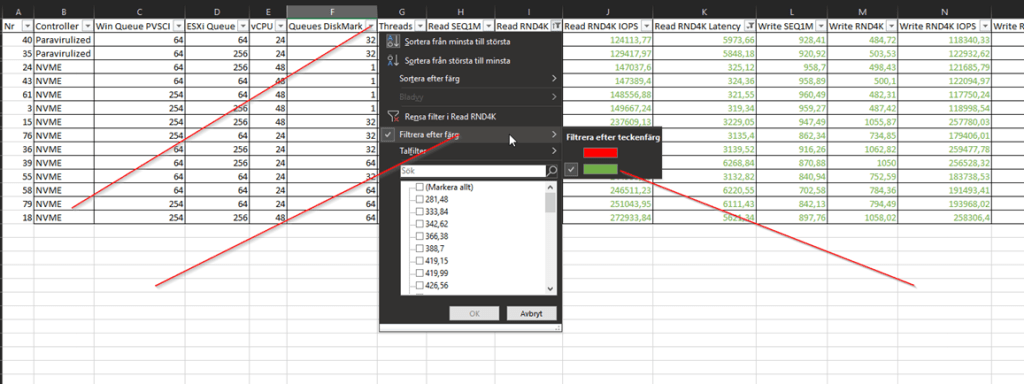
Result with everything green

Why do not we always use NVME Controller?
One downside that I had (6.7) is that you can not expand a vm disk on the fly, The VM needs to be rebooted for the disk to be expandle in Windows.
If you have read this far, congrats you are official crazy!
Here is the excel file, I promise, nothing is bad with this.
Keep hacking
// Roger

Leave a comment